- A graphical tool that displays data points in run order
- It is used to monitor process performance (variation) over time – helps us understand if we are meeting customer requirements on a regularly
- Run chart helps us to analyze the trends & patterns over time (process behavior)
- It also helps us to identify the drivers of performance
- It’s useful for baselining our process performance
- It shows process improvement

Run Chart
Run Chart Example
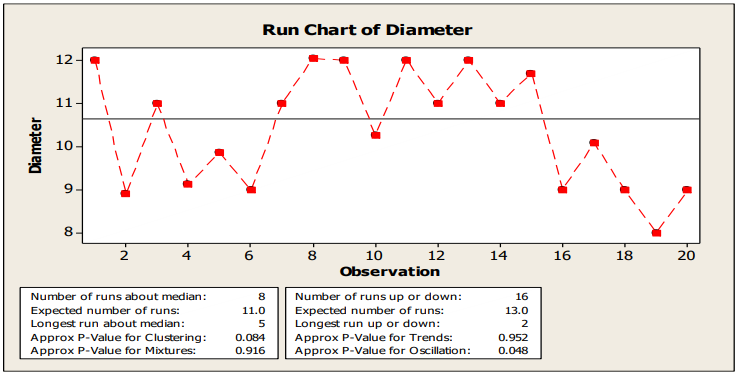
- A Run is a series of points in a row on one side of the median.
- To determine the number of runs above and below the median, count the number of times the data line crosses the median and add one. Statistically, significant change is signaled by too few or too many runs, again calculated using statistical probability.
-
Number of runs about median
- The number of runs about the median is the total number of runs above the median and the total number of runs below the median.
- A run about the median is one or more consecutive points on the same side of the center line. A run ends when the line that connects the points crosses the center line. A new run begins with the next plotted point -
Number of runs up or down
- A run-up is an upward run of consecutive points that exclusively increases. A rundown is a downward run of consecutive points that exclusively decreases. A run ends when the direction (either up or down) changes. For example, when the preceding value is smaller, a run-up begins and continues until the proceeding value is larger than the next point, then a rundown begins. -
Expected number of runs up or down
- The expected number of runs up or down is the number of runs you would expect to have in your data if the data are randomly distributed.