- A graphical tool used to display the relationship b/w an X and Y variable.
- It shows a correlation between the variables (X & Y coordinates).
- The pattern tells us about the nature and strength of the X & Y relationship used a first hand information.
- The closer the data points come when plotted to make a straight line, the higher is the correlation between variables.
- If the data points make a straight line going from the origin out to high X and Y values, then the variables are said to have a +ve correlation (Vice-versa)
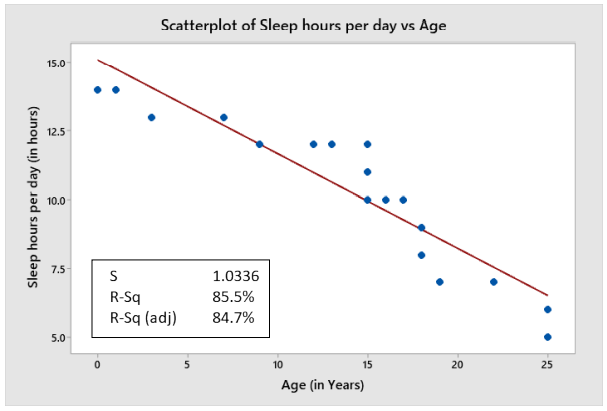
- Let us see an example of scatter plot; to find the relationship between the sleep hours per day Vs the age.
- We can see from the scatter plot that there exists a negative correlation between the sleep hours per day and the age.
- This indicates that for every increase in age there will be decrease in the sleep hours.
- The R square value of 85% indicates the model fits the data.