- There are times when the variance or 'spread' of a process is of greater interest than its mean. For instance, economists and investors use variance as a measure of risk.
- An operations application would be when quality managers or engineers want to ensure their company’s product is able to consistently meet specifications.
- The focus on variance is especially important when you are working to tight specifications which don't allow for much scope for the process/product characteristic
- Just as you would sometimes wish to compare the means of two populations, you may also wish to compare the variances of two populations.
- If you had two processes that were already perfectly centered, a comparison of the variances could tell you if either process is better.

2 Variance Test
2 Variance Test Example
- A manager is happy with the mean lead time of two processes (Process A and Process B). But he is eager to know whether the variance in lead time of process B is less than the variance in lead time of process A. He has collected 18 samples from each processes. At 95% confidence level is there enough evidence to support the claim.
- Let us conduct two variance test to validate the manager’s claim
-
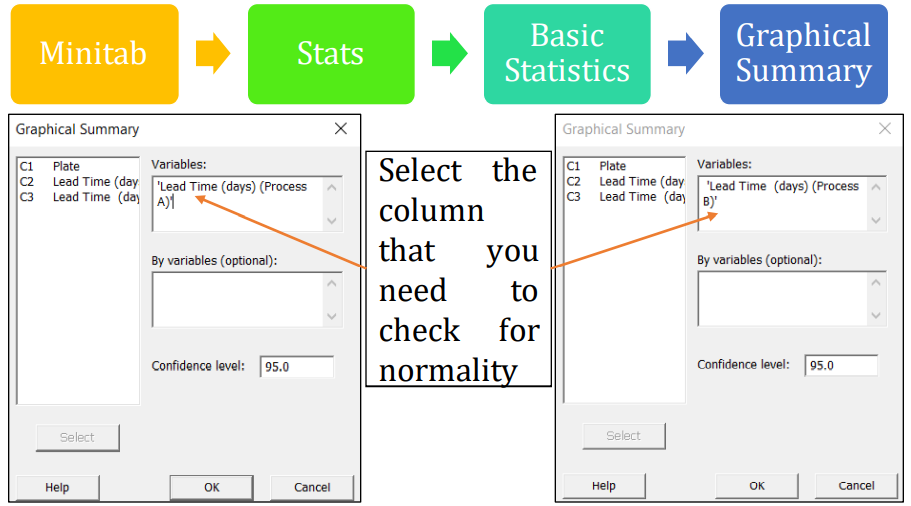
Step 1.a: Conduct Normality test
Note 1: Tests of the variance are very sensitive to the assumption of normality.
Note 2: You can also evaluate the normality test by selecting
- Minitab -> Stats -> Basic Statistics -> Normality Tests (or)
- Minitab -> Graph -> Probability Plot -
Step 1.b:Normality Check and Interpret
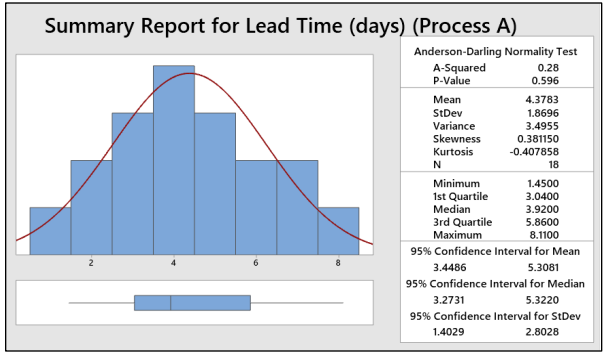
Interpret:
- As P-value is greater than 0.05, we can conclude that the data are normal and doesn’t have any outliers.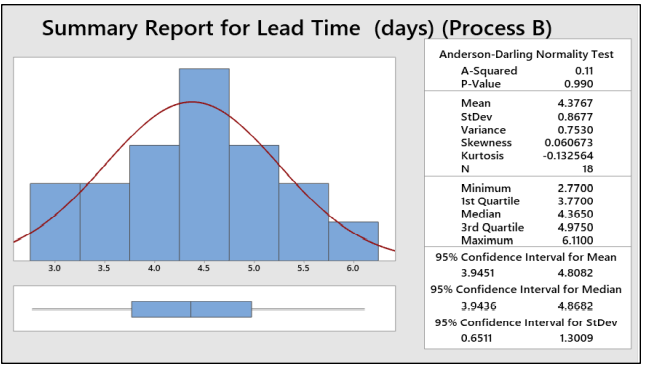
Interpret:
- As P-value is greater than 0.05, we can conclude that the data are normal and doesn’t have any outliers. -
Step 2: Hypothesis
- Null Hypothesis Ho: There is no significant difference between the variance in lead time of process A and processB
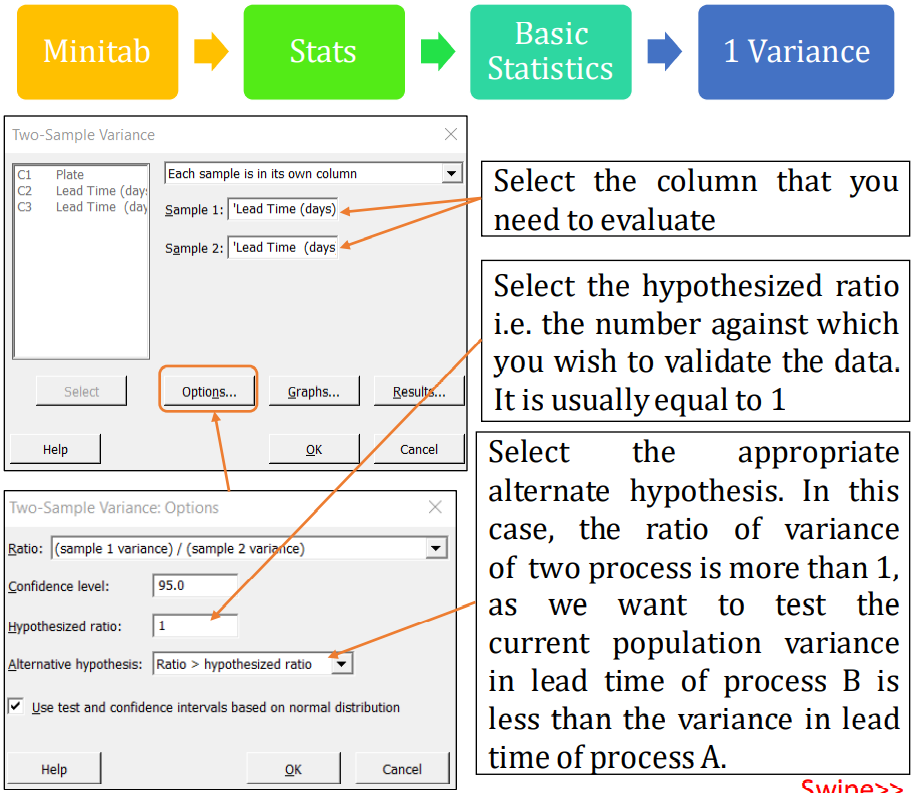
- Can be rewrittenas:(σ2 Process A ) / (σ2 Process B ) = 1
- Alternate Hypothesis Ha: The variance in lead time of process B is less than the variance in lead time of processA
- Can be rewrittenas:(σ2 process A ) /(σ2 process B ) > 1 Where σ2
- Process A : Variance in Lead Time of ProcessA (in days) σ 2
- Process B : Variance in Lead Time of ProcessB (in days)
- Ratio = σ 2 Process A /σ2 Process B
- F method was used. As this method is accurate for normal data. -
Step 3: Conduct 2 Variance Test
-
Step 4: Interpretation
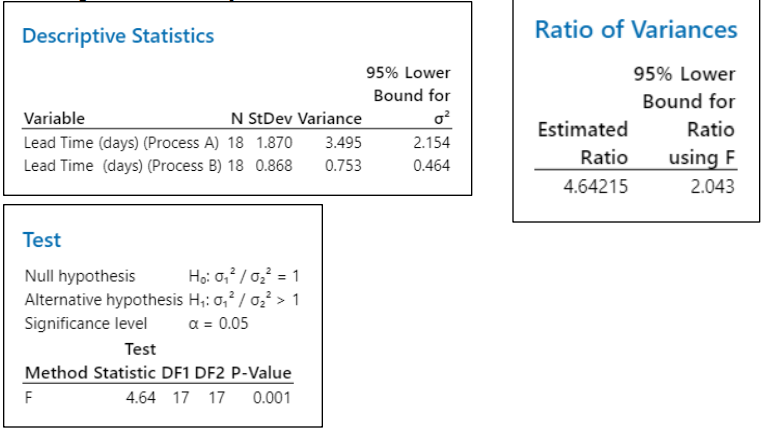
- Estimated ratio is 4.64. At 95% confidence level, the lower bound for ratio using F test is 2.043
- The lower bound for ratio using F test (2.043) is more than the target ratio (1) which is inline with the stated Alternate Hypothesis & hence reject Null Hypothesis
- P-value (0.001) is less than alpha (0.05), also indicating to reject the null hypothesis
- With above two justifications the manager can conclude that the variance in lead time of process B is less than the variance in lead time of process A