- A Box plot or Box and Whisker Plot Provide a graphical summary of the distribution of data points in a data set.
- It also provides insights to Overall shape of the data, Central Tendency, and Variability.
- A boxplot works best when the sample size is at least 20

Box Plot
A box Plot include:
- BOX – represents the middle 50% values of the data set.
- MEDIAN – represents the point for which 50% of the data points are above and 50% of the data points are below in the line.
- Q1 – Q1 represents the point for which 25% of the data points are below and 75% of the data points are above in the line.
- Q3 – Q3 represents 75% of the data points are below and 25% of the data points are above in the line.
- LINES – These vertical lines represent a whisker which joins Q1 or Q3 with the farthest data point but other than the outlier; Maximum Value = Q3+1.5(Q3-Q1) ; Minimum Value = Q1-1.5(Q3-Q1)
- ASTERIX – represents an outlier and is a point which does not belong to the family of Xs in the data
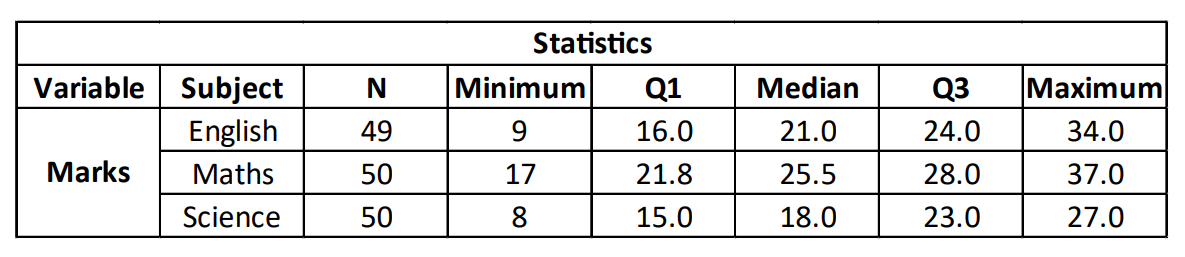
Let us look at an example of box plot.
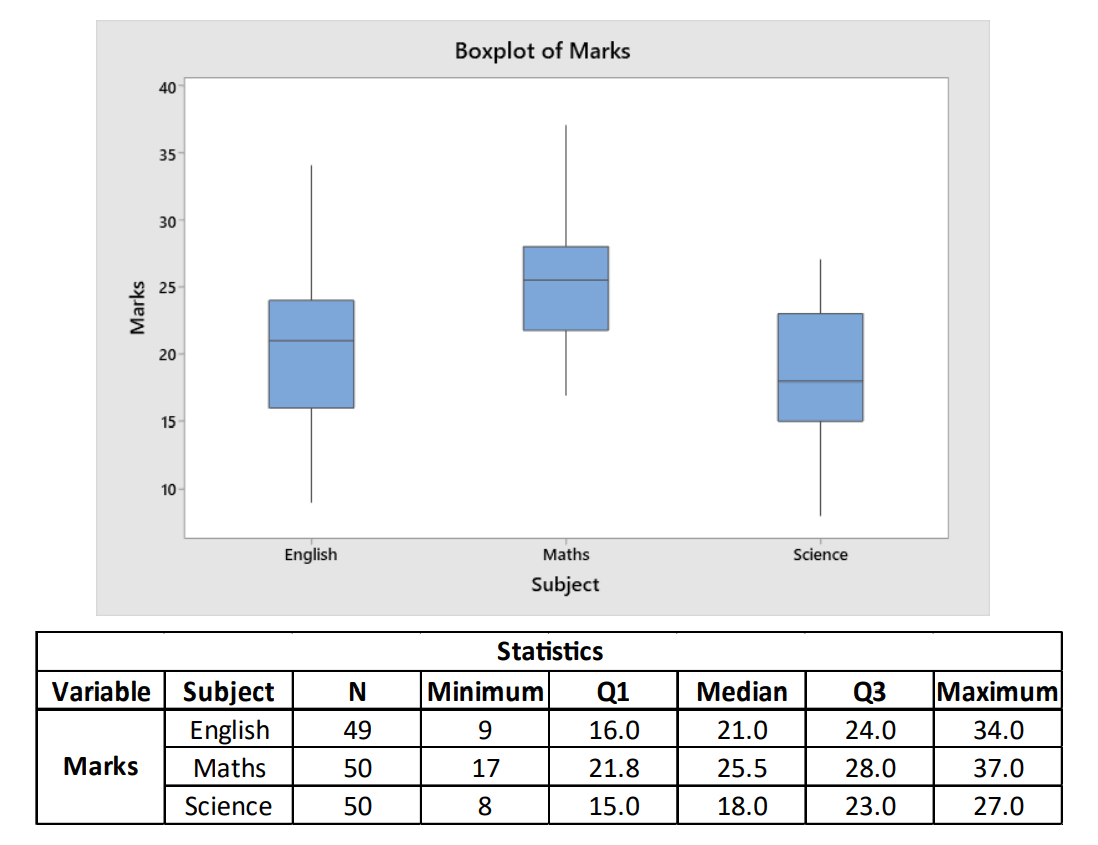
- The boxplot represents the marks scored by the students in three different subjects (Maths, Science and English) out of 40 with pass mark of 15.
- The highest marks was scored in maths and lowest marks was scored in Science.
- Overall students performed well in maths and poor in science than the other.
- In English, students doesn’t seem to perform good as the 50% of the sample scored less than 21.
- Investigate the causes and improve by eliminating or reducing the cause.