Control chart is a graph that lets us know if the process is stable or not; A process is said to be stable when the process is from special causes.
Control Charts include:
- A center line which represents the process mean
- An upper control limit (UCL) and a lower control limit (LCL), representing the limit in which the process can operate.
- Both UCL & LCL are determined by the process data itself and hence are also called Voice of Process.
When the process data goes beyond UCL or LCL or follows specific trends (not discussed here), the process is called an unstable (not stable) process or the presence of a particular cause.
Let us look at an example of a cycle time of any process.
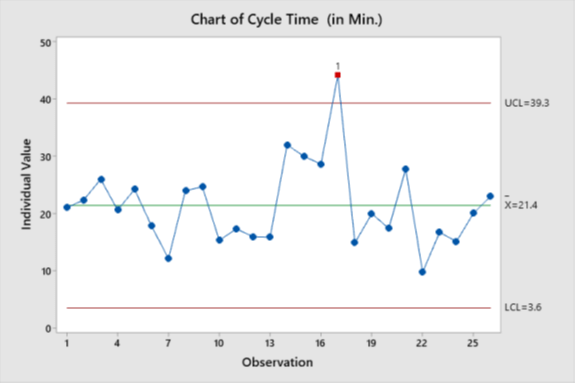
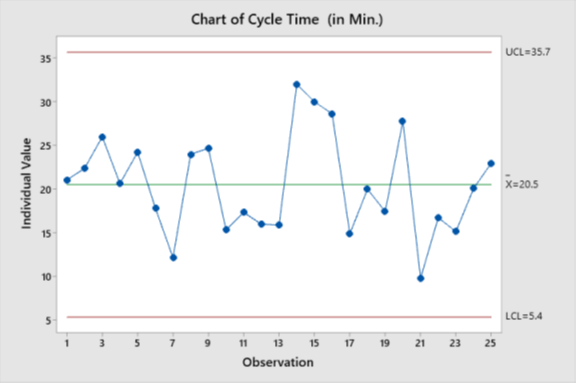
The mean of the process is = 21.4min, UCL = 39.3min and LCL = 3.6min; 17th data point, which is 41min is beyond Upper Control Limit (UCL); this is termed as the special cause & the process is unstable. Assuming the 17th point is not there, the Control chart would be stable as shown below with a new mean 20.5 min.