- Distributions are considered any population that has a scattering of data. It's important to determine the kind of distribution that the population has, so we can apply the correct statistical methods when analyzing it.
- Distributions are classifiedas per the Data.
-
Continuous Distributions
- Normal Distribution
- Z Distribution
- Student’s T Distributions
- F distribution
- Chi-Square Distribution -
Discrete Distributions
- Binomial distribution
- Poisson distribution

Distributions
Normal Distributions
- Developed by astronomer Karl Gauss
- Most prominently used distribution in statistics
- It comes close to fitting the actual frequency distribution of many phenomena
- Human characteristics such as weights, heights & IQ’s; Physical process outputs such as yields
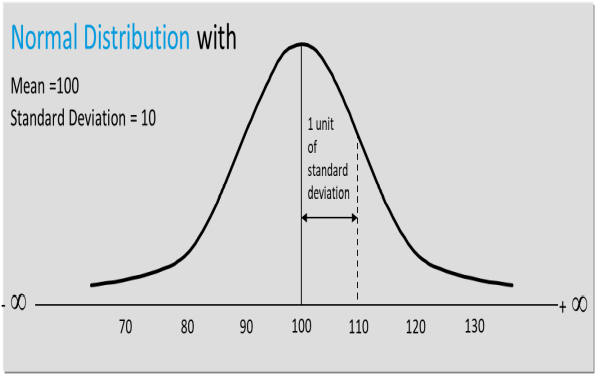
- It’s a Probability Distribution, illustrated as N,µ, σ
- Higher frequency of values around the mean & lesser at values away from mean
- Continuous & symmetrical
- Total area under the Normal curve = 1
- Mean = Median = Mode
- 50% of Data lies on either side of the tolerance
Normality Test
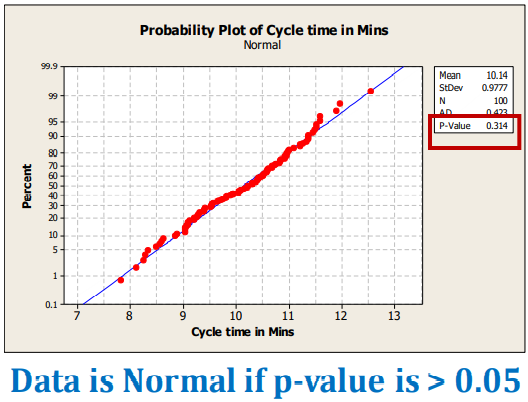
- A Normality Test is used to check if the given data is normally distributed or not.
- It is important to check for normality because many processes naturally follow the normal distribution, especially in Manufacturing, but some do not, especially in Service or Transactions
- Many statistical tools assume data to be Normal while performing various Tests
- Lack of knowledge on data distribution may result in the wrong Statistical tool's usage, which might result in incorrect output and inference of the data
- The statistical treatment of data is different if the data is non-normal
Z Distribution
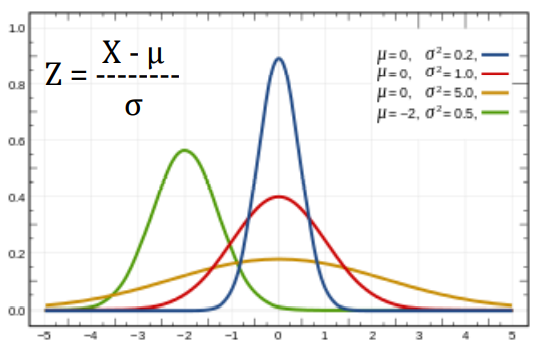
- Z-distribution is a other way of naming the Standard Normal distribution.
- The Standard Normal Distribution is a specific instance of the Normal Distribution that has a mean of ‘0’ and a Standard Deviation of ‘1’ whereas there are no such limitations for Normal distribution
- The four curves shown are Normal distributions, but only the red one is Standard Normal since its mean is zero, which means that's where it's centered, and its standard deviation is one.
- Therefore, the Z value measures the distance between a particular value of X and the mean in units of std dev.
- By determining the z value, we can find the area or prob. under the normal curve by referring to normal table.
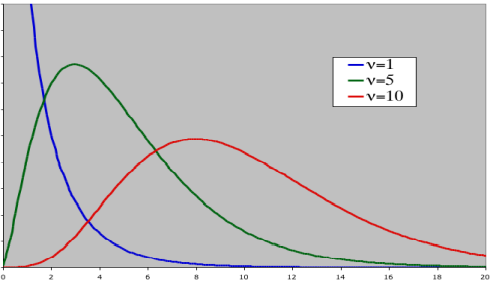
T Distribution
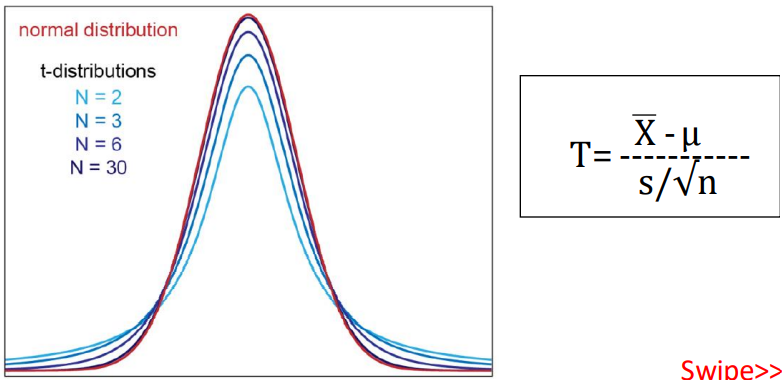
- Student T distribution or T distribution is used for finding confidence intervals for the population mean when the sample size is less than 30, and the population standard deviation is unknown.
- If you need to evaluate something with a population greater than 30, use the Z distribution
- T distribution is flatter and wider than the z distribution.
- The T distribution becomes narrower (taller) as sample sizes increase and gradually becomes very close to the normal distribution. Both z and t distributions are symmetric and bell-shaped, and both have a mean of zero.
F Distribution
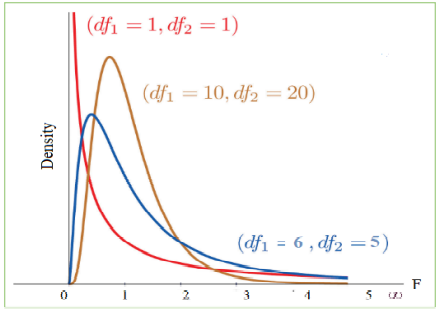
- F-distribution is used to test for equality of variances from two normal populations. The F-distribution is generally a skewed distribution & also related to a chi-squared distribution.
-
Characteristics of the F distribution
- The curve is positively skewed,and Its valueranges from 0 to ∞
- Skewness decreased with the increase of degrees of freedom of numerator and denominator
- The value of F always positive or zero.No negative values
- If degrees of freedom increases, it will be more similar to the symmetrical -
Assumptions of the F distribution
- Assumes both populations are normally distributed
- Both the populations are independent of each other
- The larger sample variance always goes in the numerator to make the right-tailed test, and the right-tailed tests are always easy to calculate
Chi-Square Distribution
- The Chi-square distribution is a measure of the difference between actual (observed) counts and expected counts.
- It is most often for hypothesis tests (when there are >2 samples) and comparing proportions and in determining confidence intervals (confidence interval for the standard deviation).
- Unlike the Normal distribution, the chi-square distribution is not symmetric. Separate tables exist for the upper and lower tails of the distribution.
- This statistical test can be used to examine the hypothesis of independence between two attribute variables and determine if the attribute variables are related and fit a certain probability distribution.
Binomial Distribution
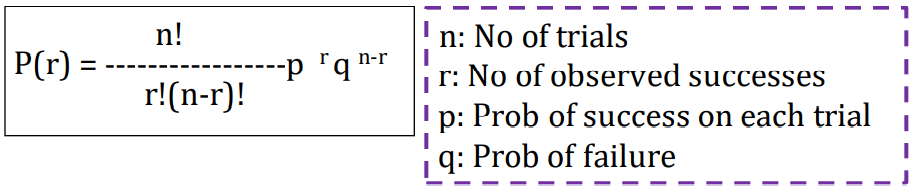
- The binomial distribution is an example of discrete distribution displaying data with only Two Possible Outcomes, and each trial includes replacement. Information is based on counts.
- Examples: Pass/ Fail, In/Out, Accept/Reject, Hot/Cold.
-
Binomial Distribution Assumptions:
- The Probability of success should be the same on every trial. The Probability of success is constant.
- Two states.Twopossible outcomes.
- Independenttrials – trials are statistically independent.
- Use Binomial Distributionwhensamplingwith replacement. -
To create a binomial distribution, we must know
- Number of trials
- Probability of success on each trial
Poisson Distribution
- The Poisson distribution is the discrete probability distribution that shows how often an event is likely to occur within a specified period of time. It is used for independent events that occur at a constant rate within a given interval of time.
- For example, a service company receives an average number of 100 service requests per day. If receiving any particular piece of service request does not affect the arrival times of future service requests, i.e., each service requests received are independent of each other, then a reasonable assumption is that the number of service requests received in a day obeys a Poisson distribution.
-
Poisson Distribution Assumptions:
- An event can occur any number of times duringa time period.
- Events occur independently. Any event does not affect the probability of another event occurring.
- The rate of occurrence is constant; that is, the rate does not change based on time
Poisson Distribution formula is: P(X; λ) = (e -λ ) (λX ) / X!
λ is the average number of events in the given time interval