Preloader

Interrelationship Diagram

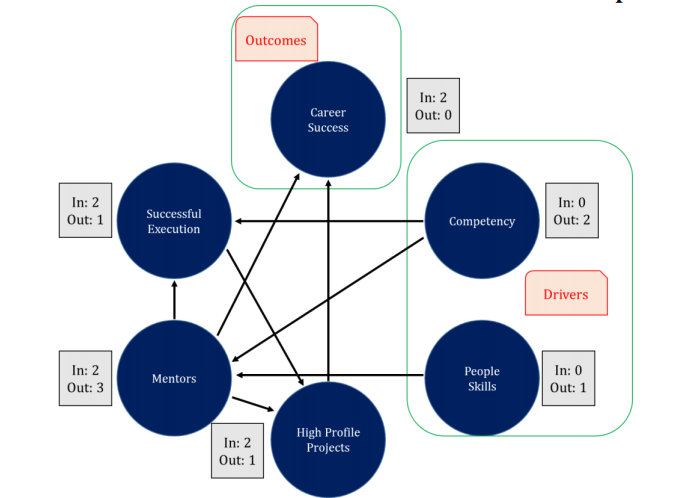
  • An interrelationship diagram (network diagram), also known as a relations diagram, is a new management planning method that portrays the relationship between factors in a complex situation.
  • It's also used to pinpoint the most critical problems and their drivers.
  • It is used when a team has trouble understanding the connections between various issues related to a process.
Will Six Sigma Be Relevant For The Future

How to use an Interrelationship Diagram

  • Develop the problem statement. Make sure the issue is presented as a complete sentence and is clear to all team members. Write this statement at the top of a white board or flip chart.
  • Brainstorm & identify the issues related to the problem & write them on a sticky note (can be written on board/paper aswell).
  • Arrange the sticky notes with issues in a circular pattern
  • Identify cause-and-effect relationships. If the team determines there is a cause/effect relationship, determine which issue is the cause and which is the result.
  • Draw an arrows from the issue that is the cause to the issue that is influenced. For strong relationships, use a solid line. For weaker relationship, draw a dashed line.Neverdrawtwo-headed arrows.
  • Tally influence arrows. For each issue, clearly record the number of arrows going in and going out.
  • Identify drivers and outcomes:
    - A high number of outgoing arrows indicates that an issue is a driver or possible root cause.
    - A high number of incoming arrows indicates that an issue is an outcome. These issues may serve as important measures of success

TOP