- Paired T-Test test is used to compare the means of two sets of observations where the comparison happen between eachrow of data.
- Each row of data in both the column are comparable to each other

Paired T-Test
Data Requirements For Paired T-Test
- The data from each sample must be in separate numeric columns of equal length. Each row contains the pairedmeasurements for an observation.
- If either measurement in a row is missing, Minitab automatically omits that row from the calculations.
Pre-requisite for Paired T-Test
- Your dependent variable should be measured at a continuous level and be approximately normally distributed
- Your independent variable should consist of two categorical,"relatedgroups" or "matched pairs".
- You should have independence of observations, which means that there is no relationship between the observations in each group or between the groups themselves.
- There should be no significant outliers.
- There needs to be homogeneity of variances.
Pre-requisite for Paired T-Test
- An Automation Engineer claiming to have reduced First Response Time across ticket categories using his RPA solutions. The team lead collects the data, for 10 ticket categories. At 95% confidence level help team lead validate if the claim made is valid.
-
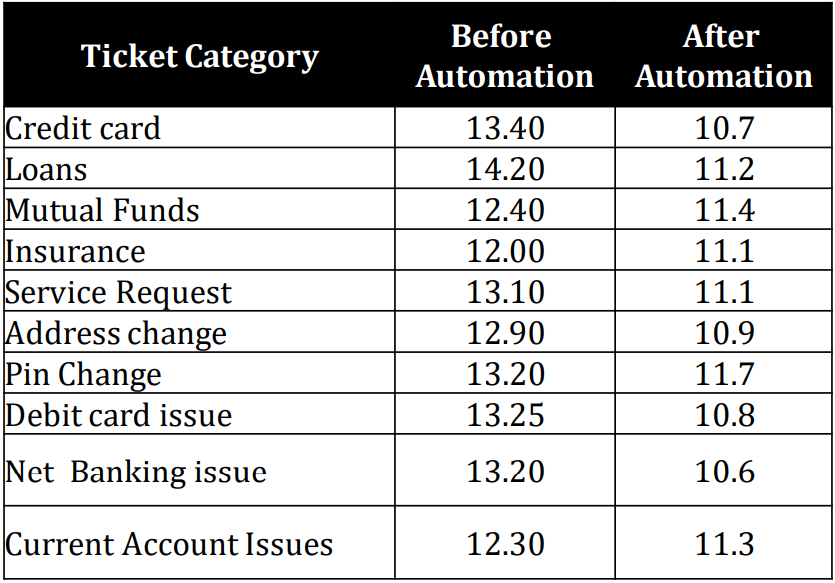
Let us conduct paired T test to find out if the difference is significant enough -
Step 1.a: Conduct Normality test
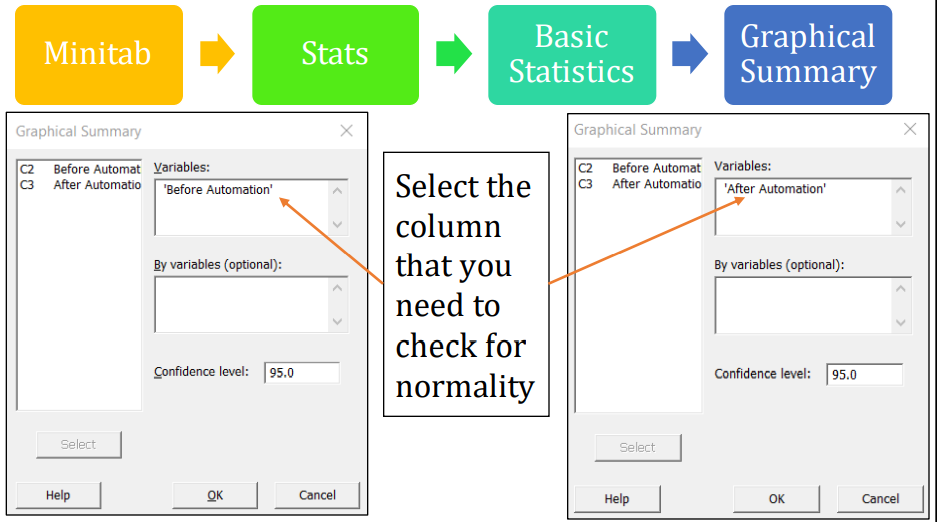
Note: You can also evaluate the normality test by selecting
Minitab -> Stats -> Basic Statistics -> Normality Tests
(or)
Minitab -> Graph -> Probability Plot -
Step 1.b:Normality Check
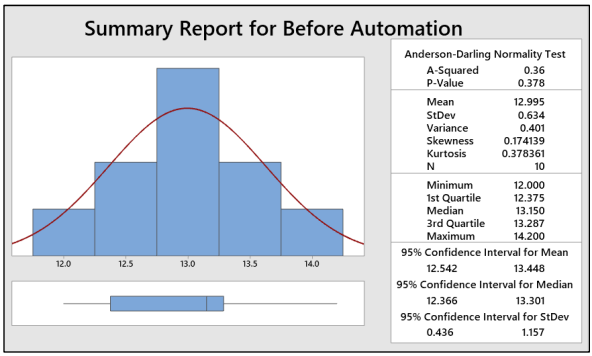
Interpret: As P-value is greater than 0.05, we can conclude that the data are normal and doesn’t have any outliers.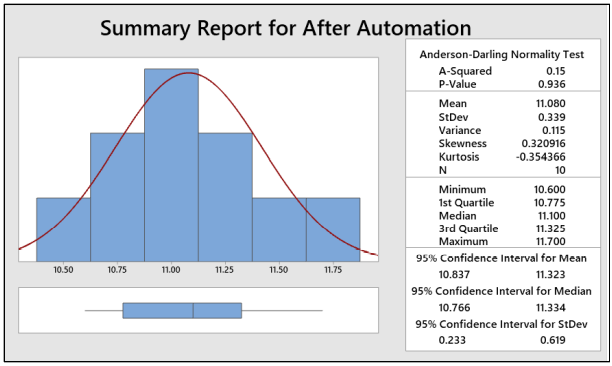
Interpret: As P-value is greater than 0.05, we can conclude that the data are normal and doesn’t have any outliers. -
Step 2: Hypothesis
Null Hypothesis Ho: There is no significant reduction in first response time across ticket categories after using RPA solutions
μ(First response time before RPA solutions – First response time after RPA solutions)= 0
Can be rewritten as i.e. μ_Difference = 0
Alternate Hypothesis Ha: There is significant reduction in first response time across ticket categories after using RPA solutions
μ(First response time before RPA solutions – First response time after RPA solutions) > 0
Can be rewritten as i.e. μ_Difference > 0
Note: μ is the mean of first response time before RPA solutions and after RPA solutions) -
Step 3: Conduct Paired T-Test
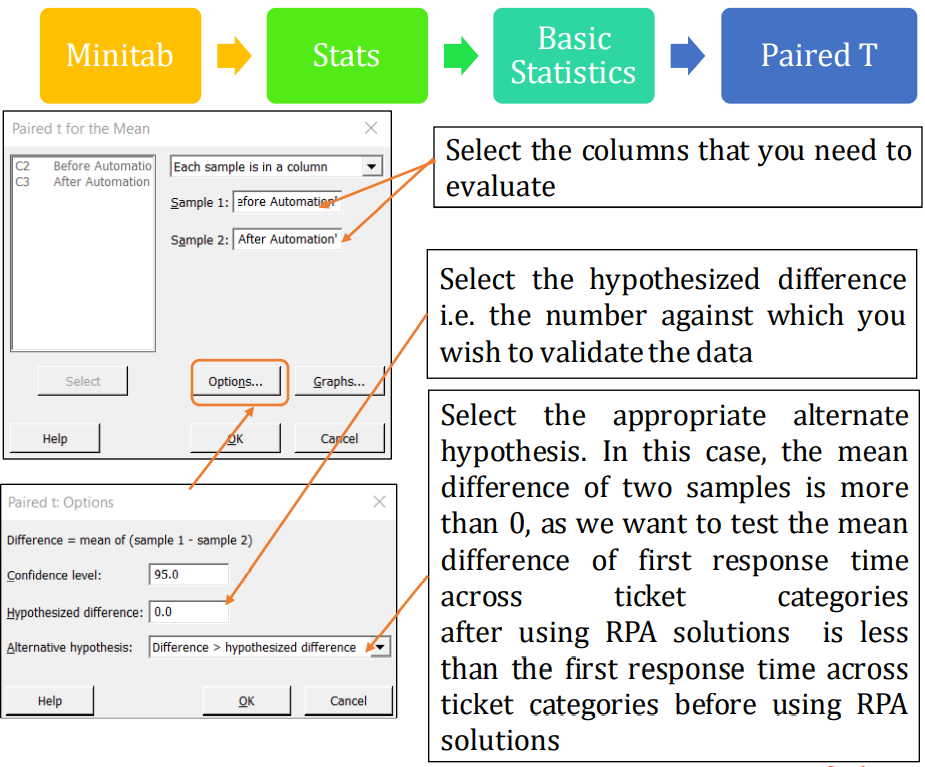
-
Step 4: Interpretation
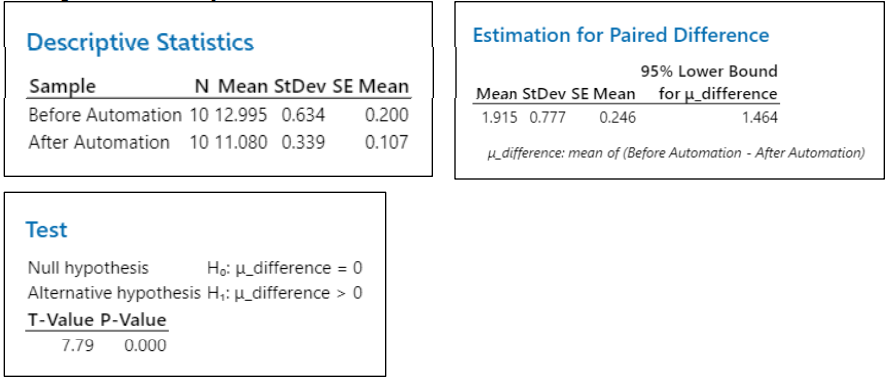
At 95% confidence level, the lower bound for difference in the mean would be 1.464
The Lower bound difference in mean (1.464) is greater than the hypothesized difference (0), which is in line with the stated Alternate Hypothesis & hence reject NullHypothesis
P-value (0.000) less than alpha (0.05), also indicating to reject the null hypothesis.
With the above two justification we can conclude there is a significant reduction in first response time after using RPA solutions