- A Box plot or Box and Whisker Plot Provide a graphical summary of the distribution of data points in a data set.
- It also provides insights to Overall shape of the data, Central Tendency, and Variability.
- A boxplot works best when the sample size is at least 20

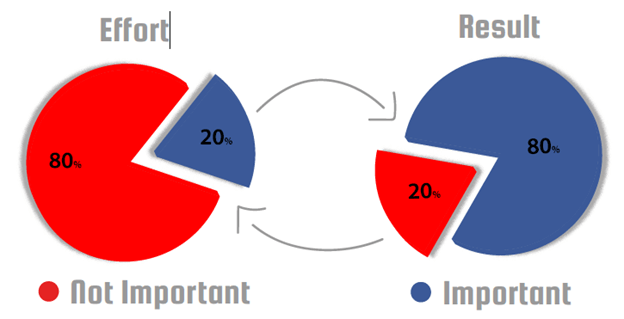
Pareto Principle
- Pareto chart helps to identify & focus on the vital few causes’ & ignore the ‘Trivial many causes.’
- Pareto is well known for Is 80:20 rule.80:20 is only an indication.Practically, 80:20 can be anything like 70:30, meaning 70% of the defects are caused by 30% of defect categories (causes).
Pareto Chart
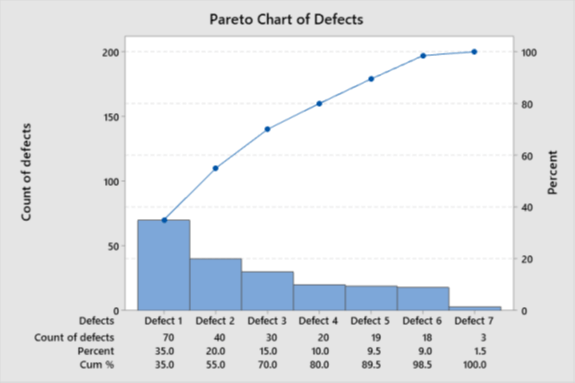
- Pareto chart is a combination of Bar graph and line graph.The Bar graph represents the count (frequency) of defects or attributes.
- Bar graph values are represented on the Primary Y-Axis.The Line represents the cumulative % of attributes.The values are represented on the secondary axis
The X-Axis of Pareto has four elements.
- Defect/Attribute name.
- Actual Count of Attribute/Defect.
- Percentage of each Defect/Attribute to the overall defects/Attributes. It is calculated by Dividing the actual count of defects by the total number of observed defects.
- Cumulative % is the total % of defects/attributes until the defect/attribute. In the example Cum% of Defect up to Defect 2 is 55%, which is the sum of the Percentage of Defect1 35% and the percentage of Defect2 20%
- In the example given ,Defect 1,2,3 contributes to 70% of overall Defects and hence can be considered a Vital few out of a total of 7 Defects.