- Two sample T-tests are utilized to resolve hypothesis testing by comparing means of two independent groups/ populations.
-
When to Use 2 Sample T-test:
Pre-project
To test the significance difference between the output with two potential causes
Mid-project
To Validate the improvements made between Before and After

2 Sample T-Test
Pre-requisite for 2 Sample T-Test
- Data must be continuous and normal
- Samples must be independentto each other
- Samples size less than 30
- It should be randomly selected from the two population and must not have any outliers
- There must be no relationship between the observations in each group or between the groups themselves.
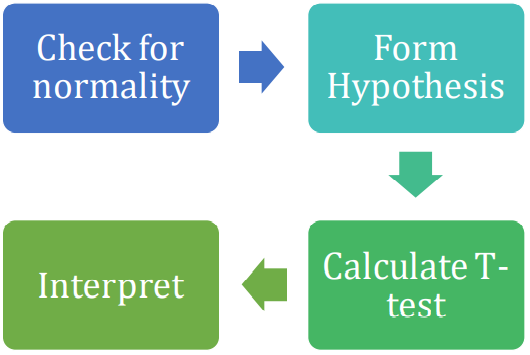
2 Sample T-Test method
2 Sample T-Test Example
- A general manager of the BPO company would like to know whether there is a difference in TAT on resolving the specific tickets between the Mumbai and Bengaluru offices. So, he randomly collects 15 samples from each office. At a 95% confidence level, the general manager wants to know whether there are differences in TAT on resolving the specific tickets between the two offices.
- Let us conduct two sample T test to find out if the difference is significant enough
-
Step 1.a: Conduct Normality test
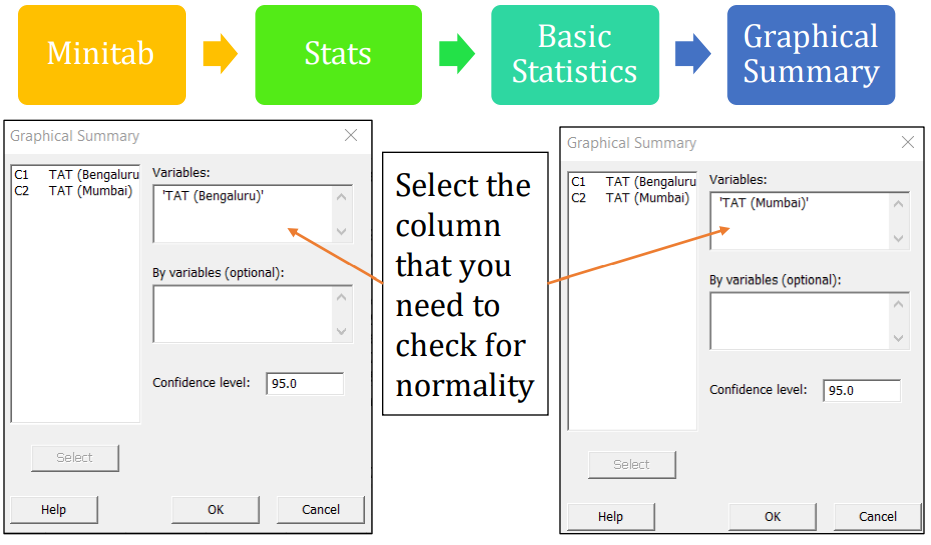
Note: You can also evaluate the normality test by selecting
Minitab -> Stats -> Basic Statistics -> Normality Tests
(or)
Minitab -> Graph -> Probability Plot -
Step 1.b:Normality Check
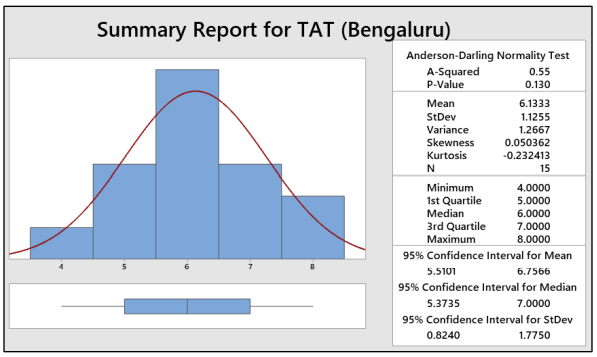
Interpret: As P-value is greater than 0.05, we can conclude that the data are normal and doesn’t have any outliers.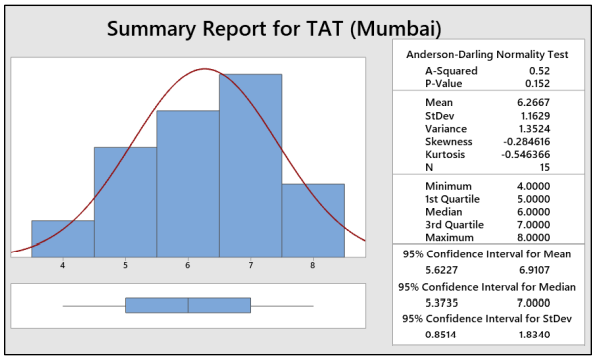
Interpret: As P-value is greater than 0.05, we can conclude that the data are normal and doesn’t have any outliers. -
Step 2: Hypothesis
Null Hypothesis Ho: There is no difference in the mean TAT between the Bengaluru and Mumbai officesi.e., μ1 = μ2 Can be re-written asHo: μ1 - μ2 = 0
Alternate Hypothesis Ha: μ1 ≠ μ2 As the manager wants to know whether the mean TAT of Bengaluru and Mumbai offices are different Can be re- written as Ha: μ1 - μ2 ≠ 0, As the TAT between the Bengaluru and Mumbai offices should be not be same and hence not equal to 0 Where μ1 is the mean TAT of Bengaluru office and μ2 is the mean TAT of Mumbai office -
Step 3: Conduct 2-Sample T-Test
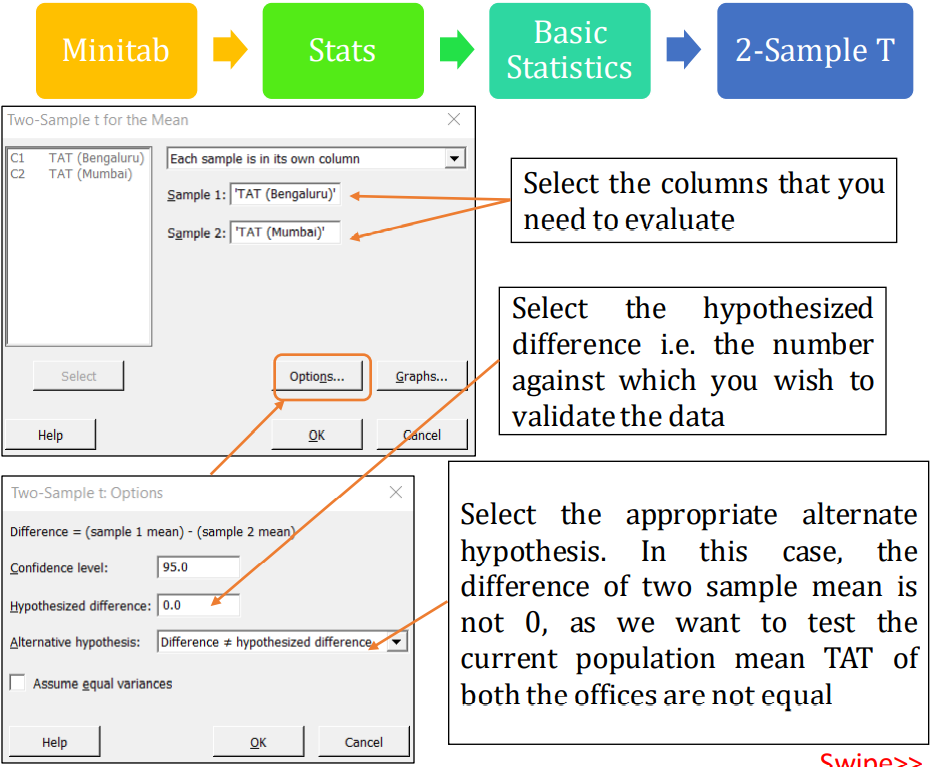
-
Step 4: Interpretation
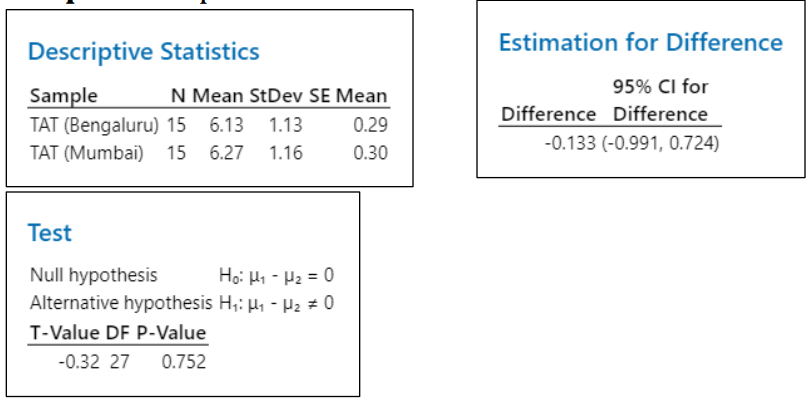
The estimated difference is -0.133. At 95% confidence level, the confidence interval for the difference is -0.991 to 0.724
The hypothesized difference (0) lies between the confidence interval. P-value (0.752) more than significance level (0.05), and hence fail to reject the null hypothesis. It also means that it is a 72.4% probability the hypothesized difference 0 lies between the confidence interval
Therefore, there is no difference between the mean TAT in resolving specific tickets from both the offices